Getting Started with mtaOpenData
Christian Martinez
Source:vignettes/getting-started.Rmd
getting-started.Rmd
knitr::opts_chunk$set(warning = FALSE, message = FALSE)
library(mtaOpenData)
library(ggplot2)
library(dplyr)
#>
#> Attaching package: 'dplyr'
#> The following objects are masked from 'package:stats':
#>
#>     filter, lag
#> The following objects are masked from 'package:base':
#>
#>     intersect, setdiff, setequal, union
Introduction
Welcome to the mtaOpenData package, a R package
dedicated to helping R users connect to the NY State Open Data portal! This package
follows the same design principles as nycOpenData and
nysOpenData.
The mtaOpenData package provides a streamlined interface
for accessing MTA-related datasets from the NY State Open Data portal.
It does this in two ways:
The mta_pull_dataset() function
The primary way to pull data in this package is the
mta_pull_dataset() function, which works in tandem with
mta_list_datasets(). You do not need to know anything about
API keys or authentication.
The first step would be to call the mta_list_datasets()
to see what datasets are in the list and available to use in the
mta_pull_dataset() function. This provides information for
thousands of datasets found on the portal.
mta_list_datasets() |> head()
#> # A tibble: 6 × 12
#>   dataset_title    open_dataset_id key   status plan_submission_date description
#>   <chr>            <chr>           <chr> <chr>  <chr>                <chr>
#> 1 MTA Subway and … 23fs-vfbd       mta_… PUBLI… COMPLETE             This datas…
#> 2 MTA Subway Orig… 28vm-gjqr       mta_… PUBLI… COMPLETE             This datas…
#> 3 MTA Bus Stops    2ucp-7wg5       mta_… PUBLI… COMPLETE             This datas…
#> 4 MTA Rail Branch… 2vcb-zrh4       mta_… PUBLI… COMPLETE             This datas…
#> 5 MTA Bridges and… 2wqd-qady       mta_… PUBLI… COMPLETE             This datas…
#> 6 MTA Workplace V… 2xh4-m2qk       mta_… PUBLI… COMPLETE             This datas…
#> # ℹ 6 more variables: plan_submission_date_notes <chr>, type <chr>,
#> #   agency <chr>, posting_frequency <chr>, dataset_created_at <chr>,
#> #   nys_url_url <chr>
The output includes columns such as the dataset title, description,
and link to the source. The most important pieces are the key
and uid. You need either in order to
use the mta_pull_dataset() function. You can supply either
the key or the uid to the dataset
argument.
For instance, if we want to pull the dataset
MTA Bus Stops, we can use either of the methods below:
mta_bus_stops_id <- mta_pull_dataset(
  dataset = "2ucp-7wg5", limit = 2)

mta_bus_stops_key <- mta_pull_dataset(
  dataset = "mta_bus_stops", limit = 2)
No matter if we put the uid or the key as
the value for dataset =, we successfully get the data!
The mta_any_dataset() function
The easiest workflow is to use mta_list_datasets()
together with mta_pull_dataset(). However, there are ample
datasets on the portal, with new ones being added all the time, and so
the list does not have all of the datasets.
In the event that you have a particular dataset you want to use in R
that is not in the list, you can use the mta_any_dataset().
The only requirement is the dataset’s API endpoint (a URL provided by
the MTA Open Data portal). Here are the steps to get it:
- On the NY State Open Data Portal, go to the dataset you want to work with.
- Click on “Export” (next to the actions button on the right hand side).
- Click on “API Endpoint”.
- Click on “SODA2” for “Version”.
- Copy the API Endpoint.
Below is an example of how to use the mta_any_dataset()
once the API endpoint has been discovered, that will pull the same data
as the mta_pull_dataset() example:
mta_bus_stop_data <- mta_any_dataset(json_link = "https://data.ny.gov/resource/2ucp-7wg5.json", limit = 2)Rule of Thumb
While both functions provide access to NY State Open Data, they serve slightly different purposes.
In general:
- Use
mta_pull_dataset()when the dataset is available inmta_list_datasets() - Use
mta_any_dataset()when working with datasets outside the catalog
Together, these functions allow users to either quickly access the datasets or flexibly query any dataset available on the MTA section of the NYS Open Data portal.
Real World Example
Not only is NYC the city that never sleeps, but also the city that’s
always moving. The Mass Transit Authority (MTA) of NYC is responsible
for millions of commuters every single day. The bus system is quite
intricate, and all of the bus stop information can be found
here. In R, the mtaOpenData package can be used to pull
this data directly.
Let’s filter the dataset to only include rows where the
route_id is “QM15”, a bus that traverses Queens and
Manhattan. The mta_pull_dataset() function can filter based
on any of the columns in the dataset. To filter, we add
filters = list() and put whatever filters we would like
inside. From our colnames call before, we know that there
is a column called “route_id” which we can use to accomplish this.
qm15_info <- mta_pull_dataset(dataset = "2ucp-7wg5",limit = 2, filters = list(route_id = "QM15"))
qm15_info
#> # A tibble: 2 × 22
#>   valid_from          valid_to            in_effect route_id route_short_name
#>   <dttm>              <dttm>              <lgl>     <chr>    <chr>
#> 1 2019-10-01 00:00:00 2019-11-11 00:00:00 FALSE     QM15     QM15
#> 2 2026-01-21 00:00:00 2026-03-25 00:00:00 FALSE     QM15     QM15
#> # ℹ 17 more variables: route_long_name <chr>, route_description <chr>,
#> #   route_color <chr>, stop_id <dbl>, stop_name <chr>, direction_id <dbl>,
#> #   direction <chr>, revenue_stop <dbl>, timepoint <dbl>, boarding <dbl>,
#> #   alighting <dbl>, is_cbd <lgl>, latitude <dbl>, longitude <dbl>,
#> #   bundle <chr>, georeference_type <chr>, georeference_coordinates <list>

# Checking to see the filtering worked
qm15_info |>
  distinct(route_id)
#> # A tibble: 1 × 1
#>   route_id
#>   <chr>
#> 1 QM15
Success! From calling the qm15_info dataset we see there
are only 2 rows of data, and from the distinct() call we
see the only qm15_info featured in our dataset is
“QM15.”
We can also add more than one criteria when filtering.
qm15_17_info <- mta_pull_dataset(dataset = "2ucp-7wg5",limit = 2, filters = list(route_id = c("QM15","QM17")))
qm15_17_info
#> # A tibble: 2 × 22
#>   valid_from          valid_to            in_effect route_id route_short_name
#>   <dttm>              <dttm>              <lgl>     <chr>    <chr>
#> 1 2019-10-01 00:00:00 2019-11-11 00:00:00 FALSE     QM15     QM15
#> 2 2021-11-15 00:00:00 2021-12-19 00:00:00 FALSE     QM15     QM15
#> # ℹ 17 more variables: route_long_name <chr>, route_description <chr>,
#> #   route_color <chr>, stop_id <dbl>, stop_name <chr>, direction_id <dbl>,
#> #   direction <chr>, revenue_stop <dbl>, timepoint <dbl>, boarding <dbl>,
#> #   alighting <dbl>, is_cbd <lgl>, latitude <dbl>, longitude <dbl>,
#> #   bundle <chr>, georeference_type <chr>, georeference_coordinates <list>
qm15_17_info_in_effect <- mta_pull_dataset(dataset = "2ucp-7wg5",limit = 2, filters = list(route_id = c("QM15","QM17"), in_effect = "true"))
qm15_17_info_in_effect
#> # A tibble: 2 × 21
#>   valid_from          valid_to            in_effect route_id route_short_name
#>   <dttm>              <dttm>              <lgl>     <chr>    <chr>
#> 1 2026-03-26 00:00:00 2026-04-10 00:00:00 TRUE      QM15     QM15
#> 2 2026-03-26 00:00:00 2026-04-10 00:00:00 TRUE      QM15     QM15
#> # ℹ 16 more variables: route_long_name <chr>, route_color <chr>, stop_id <dbl>,
#> #   stop_name <chr>, direction_id <dbl>, direction <chr>, revenue_stop <dbl>,
#> #   timepoint <dbl>, boarding <dbl>, alighting <dbl>, is_cbd <lgl>,
#> #   latitude <dbl>, longitude <dbl>, bundle <chr>, georeference_type <chr>,
#> #   georeference_coordinates <list>
We successfully filtered for:
- the latest two rows where the route was either “QM15” or “QM17”
- the latest two rows where the route was either “QM15” or “QM17” and was in effect
Mini analysis
Now that we have successfully pulled the data and have it in R, let’s
do a mini analysis on using the direction column, exploring
directional patterns in active bus routes.
To do this, we will create a bar graph of the directions
# Visualizing the distribution, ordered by frequency

mta_bus_info <- mta_pull_dataset(dataset = "2ucp-7wg5", filters = list(in_effect = "true"))

mta_bus_info |>
  count(direction) |>
  ggplot(aes(
    x = n,
    y = reorder(direction, n)
  )) +
  geom_col(fill = "steelblue") +
  theme_minimal() +
  labs(
    title = "Top Directions NYC Buses Go On Their Routes",
    x = "Count",
    y = "Direction"
  )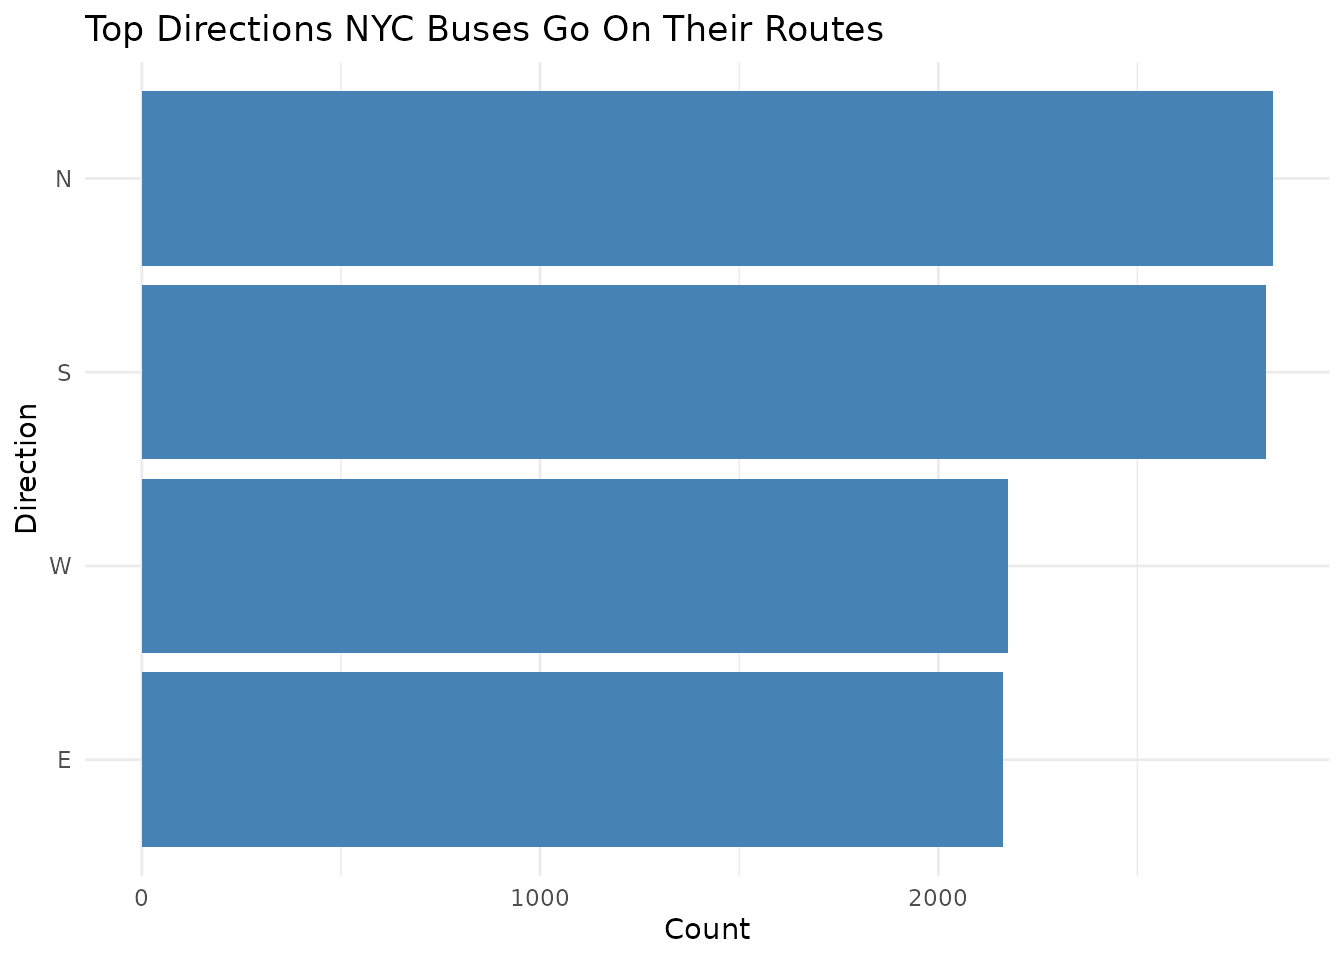
Distribution of active NYC bus route directions. Data retrieved via the mtaOpenData package from the MTA Bus Route info dataset (ID: 2ucp-7wg5).
This graph shows us which directions the buses travel the most on their current routes!
Summary
The mtaOpenData package serves as a robust interface for
the NY State Open Data portal, streamlining the path from raw city APIs
to actionable insights. By abstracting the complexities of data
acquisition—such as pagination, type-casting, and complex filtering—it
allows users to focus on analysis rather than data engineering.
As demonstrated in this vignette, the package provides a seamless workflow for targeted data retrieval, automated filtering, and rapid visualization.
How to Cite
If you use this package for research or educational purposes, please cite it as follows:
Martinez C (2026). mtaOpenData: Convenient Access to MTA Open Data API Endpoints. R package version 0.1.0, https://martinezc1.github.io/mtaOpenData/.