Getting Started with nycOpenData: data set titled NYPD Shootings Data
Joyce Escatel Flores
Source:vignettes/analyzing-nyc-shooting-incidents.Rmd
analyzing-nyc-shooting-incidents.Rmd
knitr::opts_chunk$set(warning = FALSE, message = FALSE)
library(nycOpenData)
library(ggplot2)
library(dplyr)
#>
#> Attaching package: 'dplyr'
#> The following objects are masked from 'package:stats':
#>
#>     filter, lag
#> The following objects are masked from 'package:base':
#>
#>     intersect, setdiff, setequal, union
Introduction
If you have lived or live in NYC before, you know how populated it
is. A beautiful city with many things to do. But we unfortunately know
that a very populated city can lead to us hearing about crimes that
occur or we might be curious as to what crime or what type of crime
might occur in our beautiful city. NYC now has data to show you about
every shooting incident that has occurred in NYC. Information that is
included is the date of the incident, the time it occurred, what borough
it occurred, and so much more. If you want to know more information, you
can find the dataset here.
If you want to explore this dataset more, in R, the
nycOpenData package can be used to pull this data
directly.
By using the 98wc-x49t() function, we can gather the
most recent shooting incidents in NYC!
Pulling a Small Sample
To start, let’s pull a small sample to see what the data looks like.
By default, the function pulls in the 10,000 most recent
requests, however, let’s change that to only see the latest 3 requests.
To do this, we can set limit = 3.
small_sample <- nyc_pull_dataset("98wc-x49t", limit = 3)
small_sample
#> # A tibble: 3 × 27
#>   incident_key occur_date          occur_time boro   loc_of_occur_desc precinct
#>          <dbl> <dttm>              <chr>      <chr>  <chr>                <dbl>
#> 1    308408221 2025-06-20 00:00:00 19:06:00   QUEENS OUTSIDE                104
#> 2    306062049 2025-05-08 00:00:00 00:25:00   BRONX  OUTSIDE                 47
#> 3    312202110 2025-09-01 00:00:00 19:34:00   BRONX  OUTSIDE                 49
#> # ℹ 21 more variables: jurisdiction_code <dbl>, loc_classfctn_desc <chr>,
#> #   location_desc <chr>, statistical_murder_flag <chr>, perp_age_group <chr>,
#> #   perp_sex <chr>, perp_race <chr>, vic_age_group <chr>, vic_sex <chr>,
#> #   vic_race <chr>, x_coord_cd <dbl>, y_coord_cd <dbl>, latitude <dbl>,
#> #   longitude <dbl>, computed_region_yeji_bk3q <dbl>,
#> #   computed_region_92fq_4b7q <dbl>, computed_region_sbqj_enih <dbl>,
#> #   computed_region_efsh_h5xi <dbl>, computed_region_f5dn_yrer <dbl>, …

# Seeing what columns are in the data set
names(small_sample)
#>  [1] "incident_key"                "occur_date"
#>  [3] "occur_time"                  "boro"
#>  [5] "loc_of_occur_desc"           "precinct"
#>  [7] "jurisdiction_code"           "loc_classfctn_desc"
#>  [9] "location_desc"               "statistical_murder_flag"
#> [11] "perp_age_group"              "perp_sex"
#> [13] "perp_race"                   "vic_age_group"
#> [15] "vic_sex"                     "vic_race"
#> [17] "x_coord_cd"                  "y_coord_cd"
#> [19] "latitude"                    "longitude"
#> [21] "computed_region_yeji_bk3q"   "computed_region_92fq_4b7q"
#> [23] "computed_region_sbqj_enih"   "computed_region_efsh_h5xi"
#> [25] "computed_region_f5dn_yrer"   "geocoded_column_type"
#> [27] "geocoded_column_coordinates"
We have successfully pulled NYPD Shooting Incident Data from the NYC Open Data Portal.
Mini analysis
Since we have successfully pulled the data, let’s do a quick analysis to see the location (name of column: LOC_OF_OCCUR_DESC, Either:Outside or inside) of shooting incidents in each borough (name of column: BORO).
To do this, we will create a cluster bar graph.
shooting_data<- nyc_pull_dataset("98wc-x49t", limit = 1000)

ggplot(shooting_data, aes(x = boro, fill = loc_of_occur_desc)) +
  geom_bar(position = "dodge") +
  geom_text(
    stat = "count",
    aes(label=after_stat(count)),
    position = position_dodge(width = 0.8),
    vjust=-0.2,
    size = 3) +
  labs(
    title = "Counts For Shooting Incidents",
    x="Borough",
    y="counts of shooting incidents"
  )+
  theme_minimal()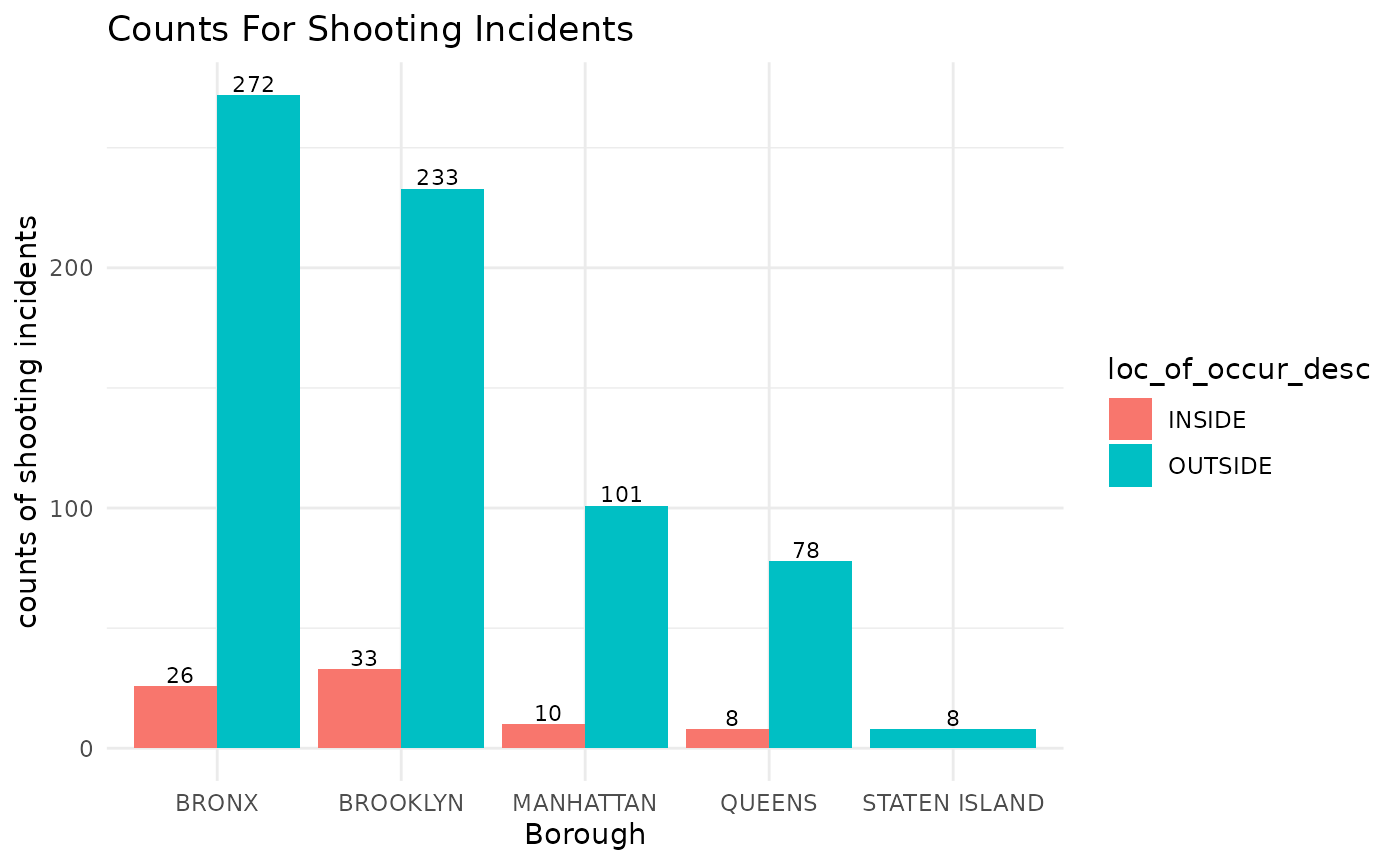
Cluster bar graph showing shooting incidents per borough based on the location of shooting.
This graph shows us the counts of shooting incidents that took place in each borough based on the location of the incident (inside or outside)